My league has abandoned their own website and has moved everything over to Play-Cricket where some of the latest scores are displayed but since quite of few of the teams don't use PCS there are omissions.
For those scores that are supplied by PCS there are a number of Play-Cricket widgets and displays but none of them really work correctly.
The problems I've noticed this year are:
The live score widget can be set to display matches for a number of days, in most cases clubs only want to display the current match so set the duration to be days=0. This is fine for one day matches but a 3 day match will not display in the widget on day 2 or 3.
None of the widgets are 'real time'. My background is in really real-time data where microseconds count but for the sake of this discussion we can call real-time data something that arrives on the display at most 1 second or so after the event happens - runs scored, wicket taken etc.
The Play-Cricket widgets operate on a polling basis - that is they retrieve the data every 3 minutes which isn't great if you are trying to follow an exciting finish.
You can follow a match by looking at the 'results' section of Play-Cricket if the scorer is using PCS and acting as a live scorer. However, once again this is polled rather than event driven so you will find yourself constantly refreshing the page to get the latest score. If you are viewing the display on a mobile device it becomes incredibly frustrating in the second innings because the default page load condition is to hide the second innings which requires you to scroll down and tap to expand the panel to see the scores. In a 3 day scrolling to the bottom to see the last innings is even more frustrating.


So what can we do about this?
Firstly we need to change the underlying mechanism used to display the data. Page refreshing went out of date in about the year 2000 there are so many better ways of doing things now - primarily delivering data to a browser as soon as the data changes.
The following videos are probably best viewed full screen. They are on YouTube so whatever video comes next after viewing mine - that is nothing to do with me!
What does this look like?
Here we have a web page which updates almost immediately after the score has been updated in PCS and we only update the data that has changed. It is easy to switch between innings.
All the displays you will see in these demonstrations can be embedded within your own club website or used as standalone web pages.
Responsiveness is a buzzword that you will hear often - basically it means that a web page will scale to the size of the screen of the device you are using. Normally this means that the layout will change or the font size will be reduced. What we can also do is use responsiveness to change the data being displayed - in this case on larger screens we can display the full names of the players - this is fully automatic.
Our real time display will tell you immediately.

We can also utilise the event driven delivery of data to put some real-time charts and gauges into webpages. This is a bit of fun, the meter displays the current run rate, if the pointer is in the green area then it is above the required run rate, yellow - a bit iffy and red seriously behind the required rate.
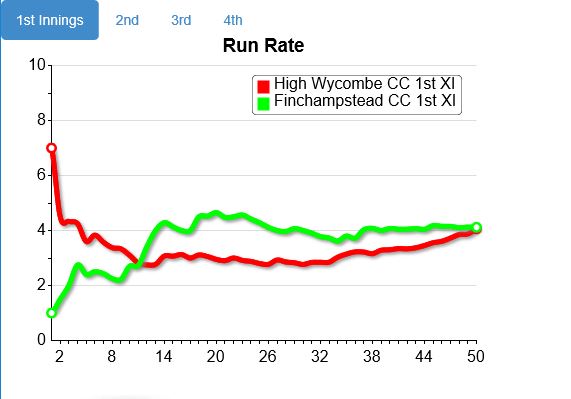
We do miss the good old worms and run-rates charts from TCS - so now we can add them to our websites. Of course all these charts update in real-time.

Here we display the duration of a batsman's innings, and the percentage of the team's runs.

Dot ball analysis in limited over matches is a bit of black magic pseudo science but we can add to it with another chart. Here we display the overs bowled, the percentage of dot balls and in the last column the percentage of wickets taken.

We can also add charts to analyse how a batsman has performed against the bowlers and how a bowler performs against the batsmen.
Firstly the bowler v the batsmen.

And the batsman v the bowlers

No comments:
Post a Comment